Showing posts with label CAPE Chemistry Unit 2. Show all posts

Wednesday, January 10, 2018

CAPE Chemistry Past Paper Answer - 2016 Unit 2 Paper 2 Question 5

Global Chemistry Lessons


Call or WhatsApp 739-2656 to join our class

L.P. #307 S.M.R. Cunupia


5(a)(i)

As applied to completely miscible binary systems, this states that the partial pressure of a constituent of a binary mixture at any given temperature is equal to the normal vapor pressure of that constituent at the stated temperature multiplied by the mole fraction of the constituent in the mixture.

5(a)(ii)

1. The interactions between components are similar to those in pure components.

2. There is no volume change on mixing the components.

5(b)(i)

An azeotropic mixture is one which boils or distils without change in composition, and in general it has a boiling point higher or lower than that of any of its pure constituents.

5(b)(ii)

An azeotrope is not a compound because its composition varies with pressure.

5(b)(iii)


Mixture X boils at a temperature T1 and at equilibrium gives off a vapor of composition Y richer in the more volatile component A. Continued distillation produces the azeotrope as the distillate while pure B is the residue.

5(c)

At equilibrium, mass of compound in water = (5-x) g and mass of compound in solvent = x g

Partition coefficient = concentration in water/concentration in ether, therefore  ((5-x)/100)/(x/25) = 0.2 i.e. x = 2.8 g.


Friday, February 24, 2017

How To Use Red Mud As A Catalyst


Can chemists come up with better uses of mineral resources to make catalysts that are more sustainable? For a growing number of researchers, the answer is yes, and the key is taking advantage of materials that are already out of the ground. Red mud, the noxious by-product of the Bayer process for extracting aluminum from bauxite ore, makes a good case study.

The majority of material processed in mining operations ultimately goes to waste. For every ton of alumina extracted from bauxite, more than a ton of red mud is produced; aluminum mining leaves behind some 120 million metric tons per year of the salty, highly alkaline, heavy-metal-laden material, according to the International Aluminum Institute. Some 4 billion metric tons of the  material is lying about globally, much of it held in retention ponds.

Mining companies have long tried to find ways to recycle the environmentally problematic red mud. It is a classic problem in search of a solution. One approach is neutralizing red mud with seawater or treating it with CO2 or sulfur compounds. The modified materials have been tried as fill for mining and construction, as pigment and filler for bricks and cement, and as a sorbent for water treatment. Others have looked at extracting more aluminum from red mud, or obtaining other useful metals such as sodium, copper, and nickel. But so far there have been few safe and economical large-scale applications.

On a new front, some chemists are trying to go catalytic, focusing on iron oxide, the chief component of red mud. But given the purity and properties of red mud, researchers have found it typically is not an active enough catalyst to compete against existing commercial catalysts. That’s because the mineral composition, particle size, and surface properties are important in developing heterogeneous catalysts. With red mud, finding the right combination is a work in progress.

One early sign of success comes from Foster A. Agblevor of Utah State University’s USTA Bioenergy Center and coworkers in conjunction with Pacific Northwest National Laboratory researchers. They have been testing red mud as a bulk catalyst to replace zeolites in a fluidized-bed reactor to pyrolyze biomass to make crude oil.

The team processes the biocrude oil using a traditional catalytic hydrotreating process to make a gasoline- type fuel and has tested it on a lawn mower or lawn trimmer. “We are able to run an engine on the fuel without difficulty,” Agblevor says. The Utah State researchers have applied for a patent for their process. They are working with catalyst company Nexceris to scale up catalyst production and with Wildland Forestry & Environmental to harvest wood from pinyon-juniper range lands in the western U.S. to scale up biofuel production.

The team is also expanding the scope of using red mud beyond biomass pyrolysis, Agblevor says. The researchers have applied the catalyst to coal gasification, he notes, as well as to a process for catalytic pyrolysis of waste tires for fuel production. Despite raw red mud’s ultimate utility as a catalyst, its story points to other possibilities for recovering metals that have already been extracted and used. For example, industrial processing, the use of consumer goods and medicines, and even the wearing away of jewelry leads to measurable amounts of catalyst metals such as gold, silver, and platinum accumulating at wastewater treatment plants.

Tuesday, February 9, 2016

Relative Acidities Of Alcohols - In Aqueous Solution

Alcohols have acidic character as the react with active metals like sodium or potassium liberating hydrogen. For example,
C2H5OH + Na C2H5ONa + ½H2

However, alcohols are weak acids. This is because they have an electron-releasing alkyl group (+I effect) which increases electron density around oxygen so that the release of a proton is rendered difficult.


Acidic character of alcohols shows the following order:

primary alcohol > secondary alcohol > tertiary alcohol

The acidic character of alcohols depends on the release of H+ from O–H. The +I effect increases  from primary alcohols (having one alkyl group) to secondary alcohols (having two alkyl groups) to tertiary alcohols (having three alkyl groups).


As a result, in tertiary alcohols, the release of a proton is most hindered making them the weakest acids of the three classes of alcohols.
In the gas phase, order of acidity is the exact opposite of that given above. Currently, this ought to be beyond the scope of the CAPE syllabus.

Friday, February 5, 2016

Phenyl Radical - Structure And Reason For Reactivity

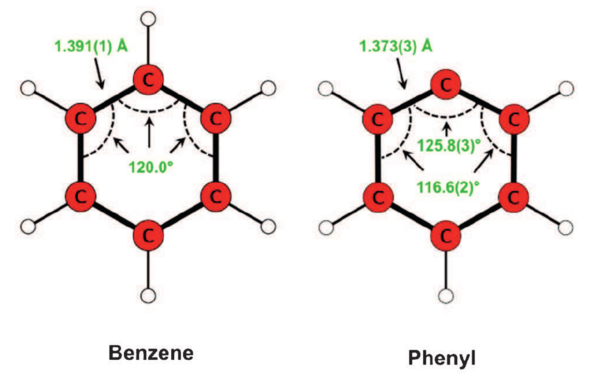
The group derived by loss of an H from benzene is a phenyl group abbreviated Ph.


The phenyl radical (C6H5·) is the prototypical σ-type aryl radical and one of the most common aromatic building blocks for larger ring molecules. Using a combination of rotational spectroscopy of singly substituted isotopic species and vibrational corrections calculated theoretically, an extremely accurate molecular structure has been determined.


Figure  1. Side-by-side comparison of the structures of benzene and the phenyl radical.

The phenyl radical (C6H5·) is a highly reactive species formed by the homolytic cleavage of a C–H bond in benzene (Figure 1), the prototypical aromatic  compound. It is one of the most common aromatic radicals, and plays a central role in many reactions, ranging from astronomy to combustion and biochemistry.

As the simplest aryl radical, it also serves as the benchmark for computational investigations of larger, open-shell ring molecules.

The reactivity of aryl radicals is due to the localization of the unpaired electron in a σ-type orbital at the C–H cleavage site, as indicated by the very high C–H bond dissociation energy of benzene (465 ± 3 kJ mol-1).


Sunday, January 24, 2016

Partition Coefficient - What's The Numerator?

The process of a solute dissolved in one solvent being pulled out, or “extracted” into a new solvent actually involves an equilibrium process. At the time of initial contact, the solute will move from the original solvent to the extracting solvent at a particular rate, but, after a time, it will begin to move back to the original solvent at a particular rate. When the two rates are equal, we have equilibrium. We can thus write the following:

Aorig Aext

in which A refers to analyte and orig and ext refer to original solvent and extracting solvent, respectively. If the analyte is more soluble in the extracting solvent than in the original solvent, then, at equilibrium, a greater percentage will be found in the extracting solvent and less in the original solvent. If the analyte is more soluble in the original solvent, then the greater percentage of analyte will be found in the original solvent. Thus, the amount that gets extracted depends on the relative distribution between the two layers, which, in turn, depends on the solubilities in the two layers. A distribution coefficient analogous to an equilibrium constant (also called the partition coefficient) can be defined as follows:


Often, the value of K is approximately equal to the ratio of the solubilities of A in the two solvents. If the value of K is very large, the transfer of solute to the extracting solvent is considered to be quantitative. A value around 1.0 would indicate equal distribution and a small value would indicate very little transfer. Uses of the distribution coefficient include:

1.the calculation of the amount of a solute that is extracted in a single extraction step,

2.the determination of the weight of the solute in the original solute (important if you are quantitating the solute in this solvent),

3.the calculation of the optimum volumes of both the extracting solvent and the original solution to be used,

4.the number of extractions needed to obtain a particular quantity or concentration in the extracting solvent, and

5.the percent extracted.

The following expansion of the previous equation is useful for these:


Saturday, November 14, 2015

Titrimetric Determination Of Ethanoic Acid Content Of Vinegar

Step 1

Rinse a cleaned 50 cm3 burette with about 5 cm3 of standardised 0.1 M NaOH solution. (Be sure to record the exact concentration of the NaOH if it is not exactly 0.1 M.) After rinsing, fill the burette with the 0.1 M NaOH solution about 2 cm3 above the 0.0 cm3 mark. Use a clean and dry funnel for filling. Tilting the burette at a 45° angle, slowly turn the stopcock to allow the solution to fill the tip. Collect the excess solution dripping from the tip into a beaker to be discarded later. The air bubbles must be completely removed from the tip. If you do not succeed the first time, repeat it until the liquid in the burette forms one continuous column from top to bottom. Clamp the burette onto a ring stand (Fig. 1). By slowly opening the stopcock, allow the bottom of the meniscus to drop to the 0.0 cm3 markCollect the excess solution dripping from the tip into a beaker to be discarded later. Read the meniscus carefully to the nearest 0.1 cm3 (Fig. 2).


Figure 1. Titration setup.


Figure 2. Reading the meniscus.

17.58 cm3 – incorrect
17 cm3 – incorrect
17.5 cm3 – correct 


Step 2

With the aid of a 5 cm3 volumetric pipette, add 5 cm3 of vinegar to a 100 cm3 conical  flask. Allow the vinegar to drain completely from the pipette by holding the pipette in such a manner that its tip touches the wall of the flask. Record the volume of the vinegar added, and the initial volume of the NaOH in the burette. Add a few drops of phenolphthalein indicator to the flask and about 10 cm3 of distilled water. The distilled water is added to dilute the natural color that some commercial vinegars have. In this way, the natural color will not interfere with the color change of the indicator.

Step 3

While holding the neck of the conical flask in your left hand and swirling it, open
the stopcock of the burette slightly with your right hand and allow the dropwise addition of the NaOH to the flask. At the point where the NaOH hits the vinegar solution the color may temporarily turn pink, but this color will disappear upon mixing the solution by swirling. Continue the titration until a faint permanent pink coloration appears. Stop the titration. Record the volume of the NaOH in your burette. Read the meniscus to the nearest 0.1 cm3 (Fig. 2).

Step 4


Repeat the procedures in steps 1–3 until consistent values are obtained.


Wednesday, November 11, 2015

Thermometric Titration - Advantages And Applications

A thermometric titration utilizes the enthalpy change of the reaction involved to locate the end point. It has been defined as “a titration in an adiabatic system yielding a plot of temperature vs. volume of titrant.” The procedure consists of delivering the titrant from a thermostated buret into a solution contained within a thermally insulated vessel. and observing the temperature change of the solution either upon continuous addition, or after each successive incremental addition, of titrant.


Advantages


These temperature-volume plots resemble the corresponding graphs obtained from conductometric, photometric, and amperometric titrations. Yet while each of the latter three methods is severely limited to specific kinds of systems - e.g., conductometric titration requires electrolytic solutes in solvents of high dielectric constant, almost all reactions exhibit detectable enthalpy changes (positive or negative). This wide applicability, coupled with simplicity, suggests a potential increase in the use of thermometric titrations in analytical chemistry, particularly in those media in which electrometric and photometric methods are inapplicable.

The analytical sensitivity of the thermometric titration method is linearly related to concentration, in contrast to the logarithmic relation to concentration which exists for many other analytical methods, e.g., potentiometric methods. A linear relation is an advantage when very dilute solutions or solutions with high concentrations of interfering ions are being analyzed. For example, a pH titration of a solution containing pyridine at a concentration below 0.05 M will give a poorly defined end point, while the end point of a thermometric titration is well defined.


Applications


Neutralization


Weak acids and bases have been studied by several workers. Bell and Cowell recommended the use of thermometric titration for the preparation of neutral solutions of ammonium citrate. Linde, Rogers, and Hume titrated both weak and strong acids and bases, showing that clear end points were obtainable even in emulsions and thick slurries, and that a mixture of sodium hydroxide and sodium carbonate could be determined with good accuracy. Jordan and coworkers show that, unlike potentiometric titration which is dependent upon free-energy changes, thermometric titration works very well even for extremely weak acids. End points are precise and accurate for acids as weak as boric acid, because the enthalpy change of neutralization is not very different from that of a strong acid.

Complexation


The greatest number of papers on thermometric titration deal with investigations of complex formation, all of which are of analytical importance either directly or indirectly. For EDTA titrations, an accuracy within 3% is possible with cation concentrations as low as 0.0005 M.